About CompTIA Project+ (PK0-005)
The CompTIA Project+ Certification validates fundamental project management knowledge for managing small to medium-sized projects. It integrates traditional, Agile, and hybrid methodologies to teach candidates how to initiate, plan, execute, monitor, and close projects effectively.
The PK0-005 exam covers four domains:
- Project Management Concepts (33%)
- Project Life Cycle Phases (30%)
- Tools and Documentation (19%)
- Basics of IT and Governance (18%)
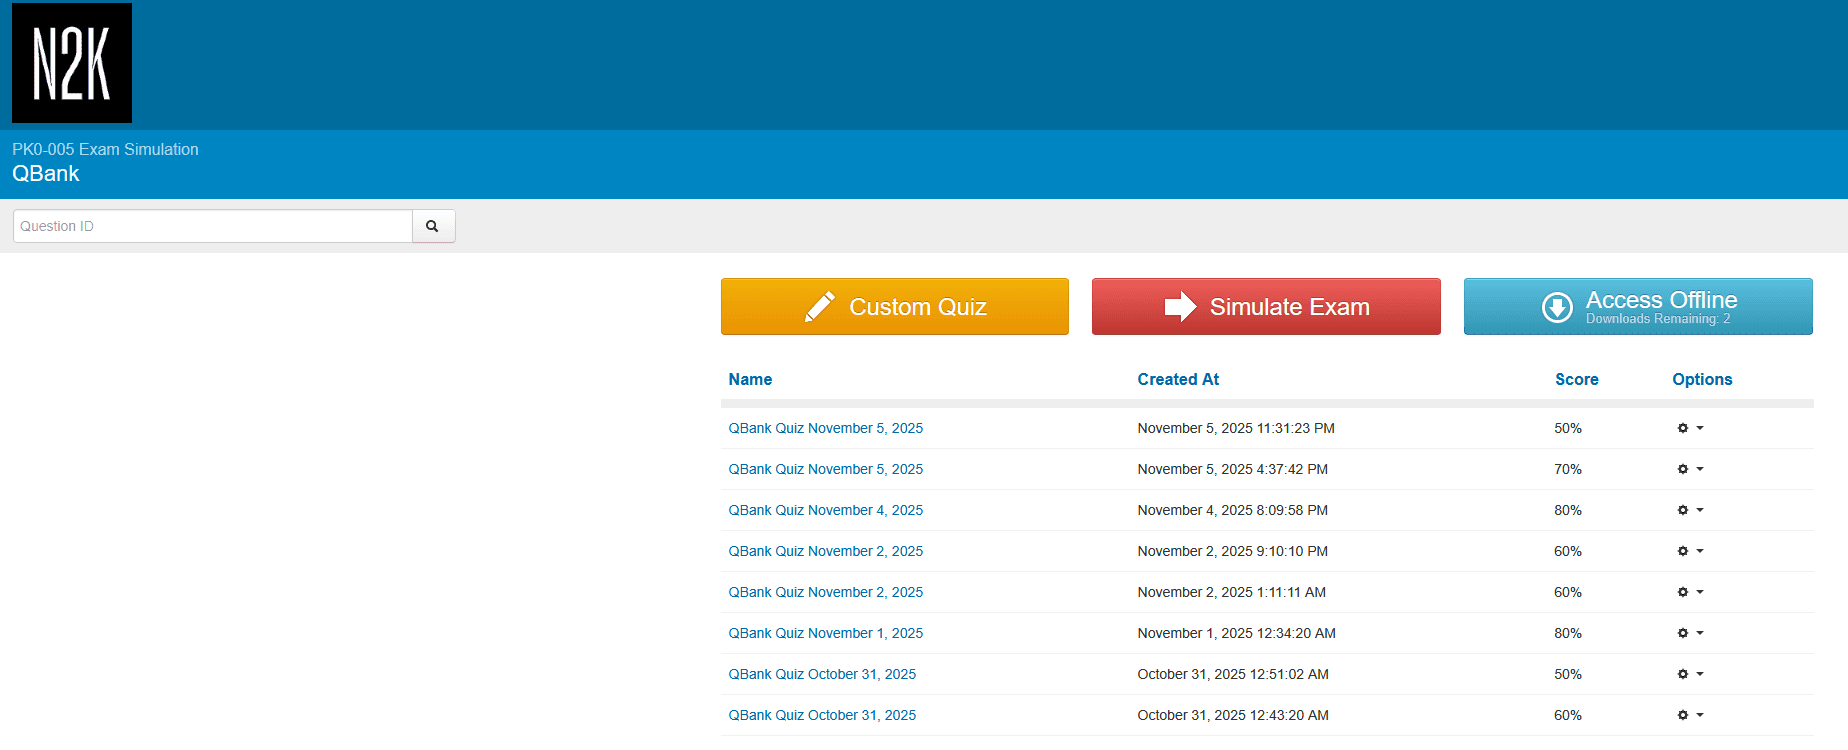
Getting Started#
I passed the CompTIA Project+ PK0-005 on 7-Nov-2025!
My Strategy#
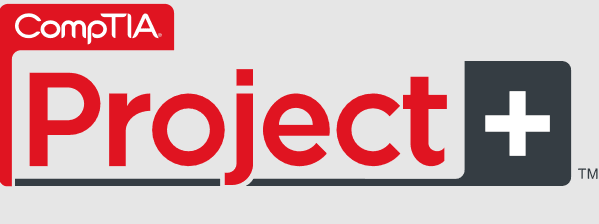
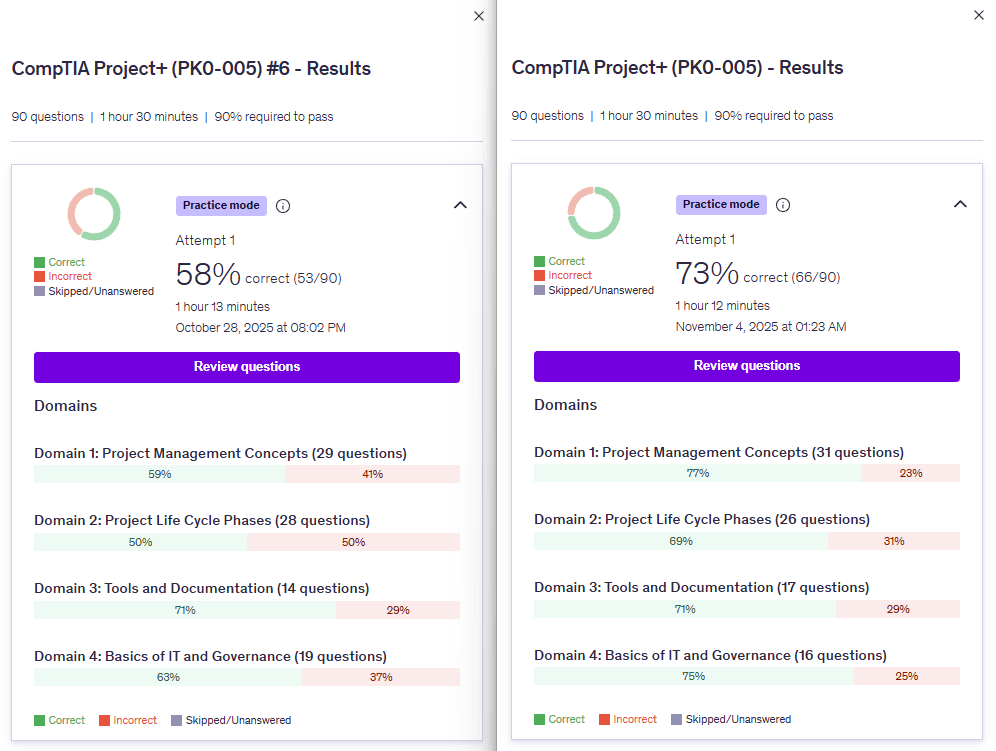
I started by listening to the Dion Udemy course and CBT Nuggets course/path/skills. Then I took my first round of practice exams and...well... that didn't go very well.
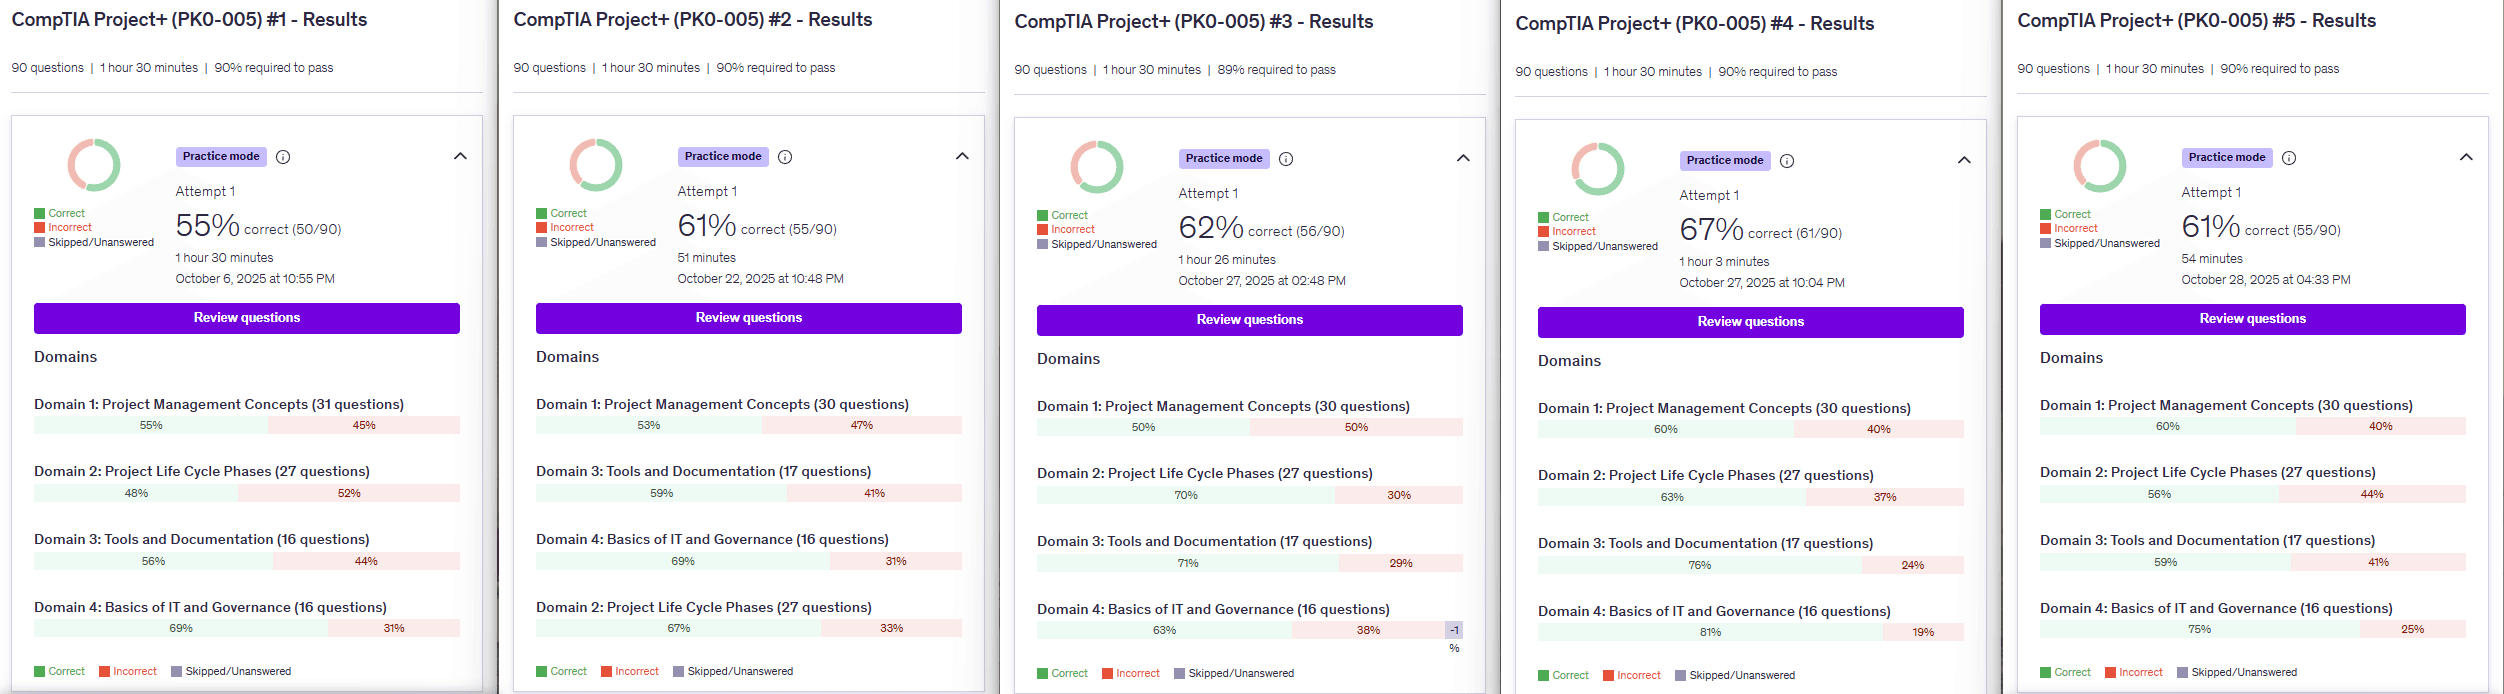
Notice that I did hit a 73% correct on the Dion practice on November 4th and that these are different practice tests. You can see through the dates that I progressively get better as I take these practice tests and go through the courses. It helps so that the content I'm learning, through video courses, retains. Then I began to retake the tests, without studying answers, to see if I was ready prior to my exam date.
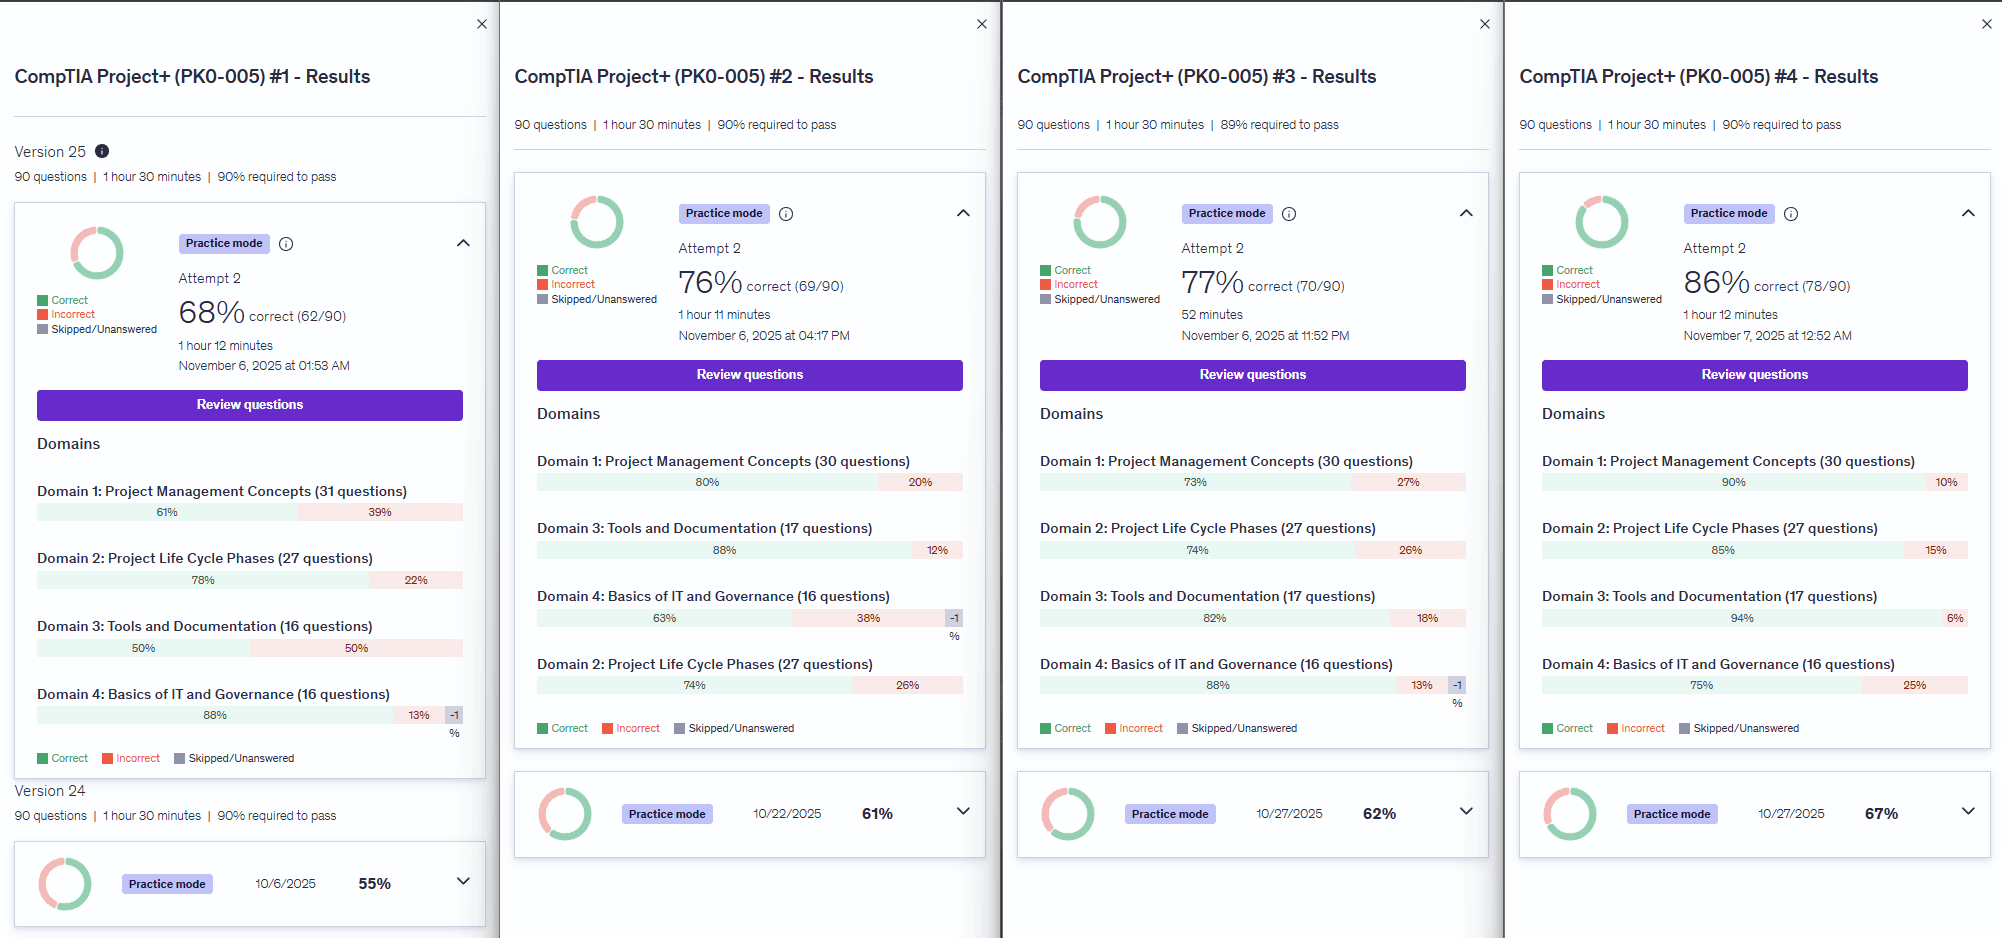
I scored 86% correct, on my final practice test, the morning before my certification exam. This helped me build confidence. My final step was reading over the explinations to the questions I missed and making sure I understood them.
Now I'll share my resources and some of my study notes below. Enjoy!
Recommended Resources:
- Udemy: Jason Dion’s Project+ Course↗
- Udemy: Jason Dion’s Project+ Practice Exams↗
- CBT Nuggets: CompTIA Project+ (PK0-005) Skills↗
- Quizlet: Project+ PK0-005 Flashcards↗
- Serena's Study Videos: Project+ PK0-005 Study Questions↗
Domain 1: Project Management Concepts (33%)#
Key Definitions#
- Project: A temporary endeavor with a defined outcome and end date.
- Program: A coordinated group of related projects.
- Portfolio: Projects or programs aligned with strategic goals.
- Operations: Ongoing, repeatable business processes.
Triple Constraint (Iron Triangle)#
Scope + Time + Cost = Quality A change in one will affect the others, requiring balance among all three. Less scope delivered quickly and cheaply aligns well with Agile's MVP.
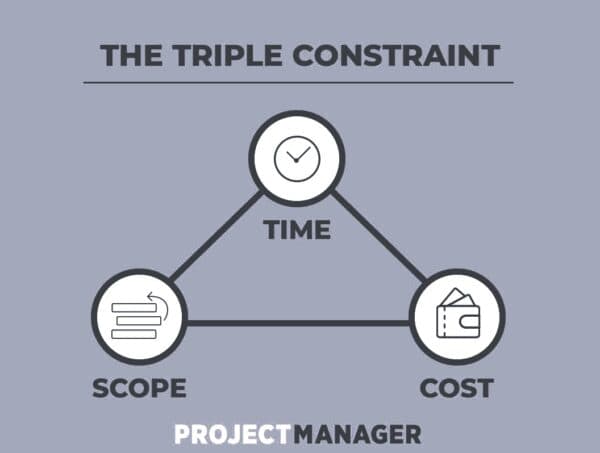
If one constraint changes (e.g., schedule compression), immediately reassess impacts on scope and cost before approval.
Business Case vs. Project Charter#
The Project Business Case: A value proposition for a proposed project that may include financial and non-financial benefits. The business case answers critical questions:
- Business Needs: What problems or opportunities exist? (Root cause analysis)
- Analysis: What information do we need to address the need?
- Strategic Alignment: Does this project fit our organization's goals and objectives?
- Recommendation & Options: What options are available for addressing the need?
- Feasibility Study: Is it doable? What is the ROI (Return on Investment)?
The business case guides decision-makers in determining whether a project should proceed.
| Document | Purpose |
|---|---|
| Business Case | Justifies why the project should be done and if it should proceed. Answers business need, strategic fit, and ROI questions. |
| Project Charter | Authorizes the project to begin and assigns a project manager with authority. Transforms an approved business case into a project mandate. |
The Business Case may evolve directly into the Project Charter once approved by leadership. A strong business case ensures stakeholder alignment on the why; the charter ensures clear authorization for the how.
Leadership & People#
- Servant Leadership — Puts team needs first and enables high performance.
- Coaching — Develops individual strengths via feedback and mentoring.
- Transformational — Inspires through vision and motivation.
- Democratic (Participative) — Involves the team in decisions.
Conflict Resolution: Collaborate (win‑win), Compromise, Avoid, Compete, Accommodate. Verification vs. Validation: Verification checks specs; Validation checks user expectations.
Organizational Structure Types#
The structure of an organization affects how projects are managed, resource availability, and the project manager's authority. There are three primary organizational structures:
| Structure | Definition | PM Authority | Resource Control | Best For |
|---|---|---|---|---|
| Functional | Organized by departments/functions (Engineering, Finance, HR, etc.). Resources report to their functional manager. | Little to None — PM has limited authority; resources prioritize functional work first. | Functional managers control resources; PM must negotiate. | Stable, traditional organizations with clear departmental lines. |
| Projectized | Organized around projects. Resources report directly to the project manager. | Full Authority — PM has complete control over project work and resources. | PM controls all project resources for the duration. | Organizations that prioritize projects (consulting firms, software development). |
| Matrix | Hybrid structure—still organized by function, but project management is one of those functions. Resources report to both functional managers AND project managers. | Varies: Weak → Balanced → Strong — PM authority increases along the spectrum. | Shared control—functional manager and PM negotiate resource allocation. | Large organizations needing both functional expertise and project focus. |
Matrix Organization Breakdown:
- Weak Matrix: Functional managers retain most authority; project manager has advisory role (closest to functional).
- Balanced Matrix: Project manager and functional managers share authority equally.
- Strong Matrix: Project manager has most authority; functional managers support (closest to projectized).
Understanding your organization's structure is critical—it determines how much authority you have to manage scope, schedule, and resources.
- Understand predictive vs. adaptive approaches: Waterfall works best for fixed requirements and low uncertainty, while Agile excels with changing/emerging requirements.
- Leadership Styles Matter: Servant leadership, coaching, transformational, and democratic styles all drive team performance—know the context for each.
- Conflict Resolution Priority: Collaborate for win-win solutions first; know when to compromise, avoid, compete, or accommodate based on the situation.
- The Triple Constraint is Your Framework: Scope + Time + Cost = Quality. Changes to one will affect the others. Help stakeholders understand this balance.
Development Methodologies#
| Methodology | Description | Best For |
|---|---|---|
| Waterfall | Linear, phase‑by‑phase model (Requirements → Design → Implementation → Testing → Delivery → Maintenance). | Fixed requirements & low uncertainty. |
| Agile | Iterative, incremental, adaptive model. | Changing/emerging requirements. |
| Scrum | Iterative Agile framework using sprints; roles: Scrum Team, Product Owner, Scrum Master, Developers. | Product delivery. |
| Kanban | Lean pull system optimizing flow; famous for task boards. | Continuous delivery. |
| Lean | Remove waste; maximize value. | Process efficiency. |
| XP (Extreme Programming) | Engineering discipline within Agile; roles: Customer, Tracker, Coach. | Software teams. |
| SAFe | Scaled Agile for enterprise environments. | Cross‑team programs. |
| PRINCE2 | Process‑based governance framework with principles: continued business justification, learn from experience, defined roles, manage by stages/exception, focus on products, tailor to context. | Highly controlled projects. |
Predictive = Waterfall. Adaptive = Agile. Hybrid blends both.
The 12 Principles of Agile#
The Agile Manifesto defines 12 core principles that guide Agile teams in delivering value and responding to change. Understanding these principles is critical for Project+ and practical project management:
- Highest Priority: Satisfy the Customer — Deliver valuable software frequently and continuously.
- Welcome Changing Requirements — Agile harnesses change for the customer's competitive advantage, even late in development.
- Deliver Working Software Frequently — From a couple of weeks to a couple of months, with a preference for the shorter timescale.
- Business People & Developers Must Work Together Daily — Throughout the project, ensuring alignment and shared understanding.
- Build Projects Around Motivated Individuals — Give them the environment and support they need, and trust them to get the job done.
- Face-to-Face Conversation — The most efficient and effective method of conveying information within a development team.
- Working Software is the Primary Measure of Progress — Not lengthy documentation, but tangible deliverables.
- Agile Processes Promote Sustainable Development — Sponsors, developers, and users should be able to maintain a constant pace indefinitely.
- Continuous Attention to Technical Excellence & Good Design — Enhances agility and prevents technical debt.
- Simplicity — The art of maximizing the amount of work not done is essential to agility.
- Best Architectures, Requirements, & Designs — Emerge from self-organizing teams that reflect on their work.
- Regular Intervals for Team Reflection — The team reflects on how to become more effective, then tunes and adjusts its behavior accordingly.
Types of Organizational Change#
Projects often drive organizational change. Understanding different types of organizational change helps project managers anticipate stakeholder impact and resistance. Common types include:
| Change Type | Description | Impact |
|---|---|---|
| Business Merger or Acquisition | Two separate entities consolidate legally; one business buys another. Creates alignment of goals and integration of operations. | May cause confusion about new goals/stakeholders; integration challenges; cultural clashes. |
| Business Demerger or Split | Organization breaks up into separate, independent entities. | Change in goals and resource allocation; potential negative impact due to loss of shared resources and expertise. |
| Internal Reorganization | Restructuring of roles, reporting lines, and responsibilities within the same organization. | May require re-negotiation of resource allocation; schedule delays if roles/responsibilities change mid-project; staff anxiety about new structures. |
As a project manager, be prepared to manage stakeholder concerns about these organizational changes. They may affect team composition, priorities, resources, and project scope.
Agile Metrics & Visual Tools#
| Chart | Purpose |
|---|---|
| Burndown Chart | Tracks remaining work vs. time. Used to forecast sprint completion. |
| Burnup Chart | Tracks cumulative work completed. Shows progress toward total scope. |
| Velocity Chart | Story points completed per sprint. Helps forecast project completion. |
| Throughput Chart | Items (count) completed per iteration. Alternative to velocity for non-story-point teams. |
| Cumulative Flow Diagram | Shows work at each stage (To Do, In Progress, Done) over time. Identifies bottlenecks. |
Burndown Chart Example
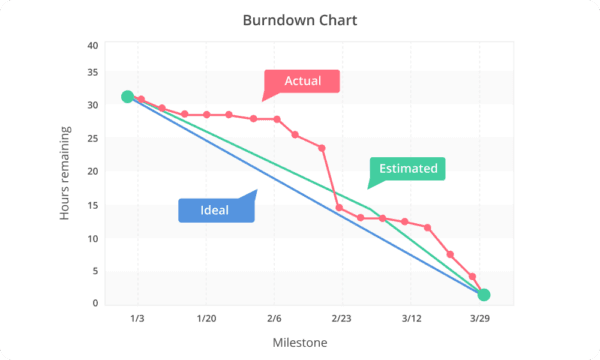
A burndown chart visualizes the amount of work remaining (vertical axis) over the course of the sprint (horizontal axis). A steep downward slope indicates steady progress, while a flat or rising line indicates issues or delays.
Burnup Chart Example
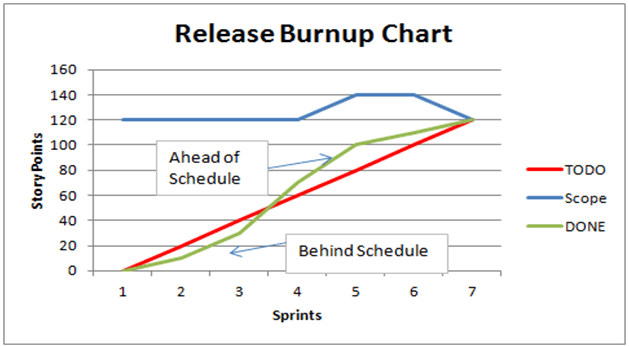
A burnup chart tracks the opposite perspective—showing cumulative work completed over time. It's useful for stakeholders who want to see progress toward the goal rather than remaining work.
Throughput Chart Example
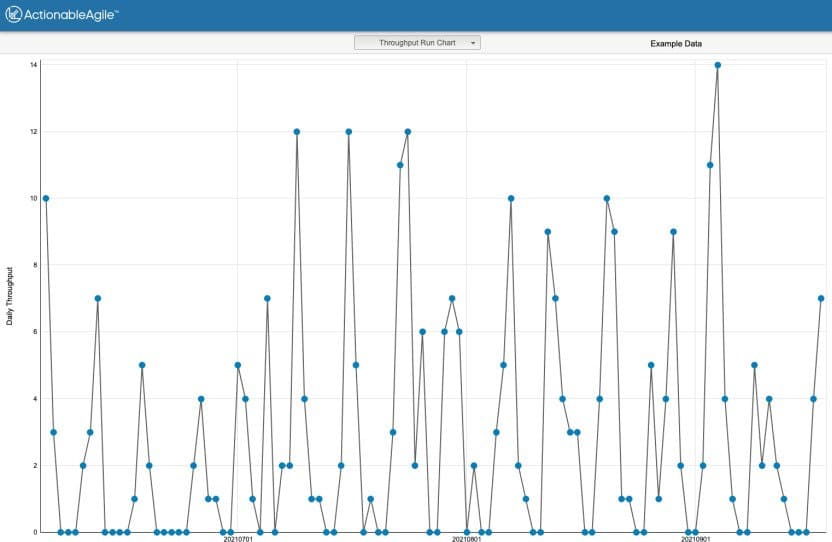
The throughput chart displays the number of items (e.g., user stories, tasks) completed per sprint. Teams without story points use throughput to forecast project completion.
Velocity Chart Example
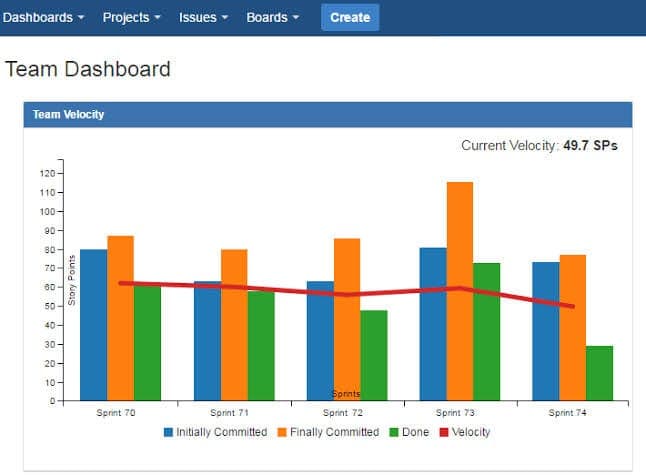
The velocity chart displays the number of story points completed per sprint over time. This chart helps teams forecast how many sprints are needed to complete the remaining backlog. For example, if your team completes an average of 20 story points per sprint and you have 200 points remaining, you can estimate roughly 10 sprints to completion.
Cumulative Flow Diagram
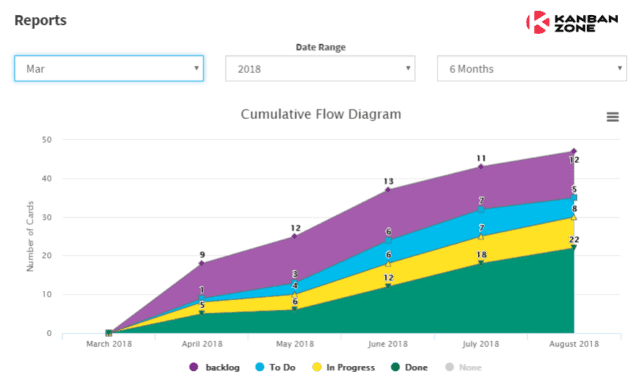
The cumulative flow diagram (CFD) shows the distribution of work across stages (To Do, In Progress, Done) over time. A widening band between stages indicates bottlenecks where work is accumulating.
Agile Ceremonies & Practices#
Sprint Planning:
- Team commits to work for the sprint (typically 1-2 weeks).
- Stories are estimated using story points (relative sizing: 1, 2, 3, 5, 8, 13, etc.).
- Definition of Ready (DoR) ensures stories are well-defined before commitment.
- Output: Sprint Backlog (selected user stories for the sprint).
Daily Standup (Daily Scrum):
- 15-minute timeboxed meeting.
- Each team member shares: What I did yesterday, what I'll do today, any blockers.
- Purpose: Synchronization and identifying issues quickly.
Sprint Review (Demo):
- Demo completed work to stakeholders.
- Gather feedback for next sprint.
- Reorder product backlog based on feedback.
Sprint Retrospective:
- Team reflects on process: What went well? What can improve?
- Identify actionable improvements for next sprint.
- Psychological safety is key—blameless culture.
Product Backlog Management:
- Backlog Refinement/Grooming: Product Owner works with team to clarify requirements and estimate stories.
- User Stories: "As a [role], I want [feature], so that [benefit]."
- Acceptance Criteria: Clear conditions for story completion.
- Prioritization: Product Owner prioritizes by business value, risk, dependencies.
Agile Metrics & Velocity#
Velocity:
- Average story points completed per sprint.
- Used to forecast project completion.
- Example: If velocity is 20 points/sprint and 200 points remain, ~10 sprints to completion.
Definition of Done (DoD):
- Shared understanding of what "complete" means.
- May include: code review, testing, documentation, deployment.
- Ensures consistent quality across sprints.
Agile Benefits vs. Waterfall:
- Faster feedback: Iterate and adjust based on user feedback.
- Risk reduction: Identify issues early, adapt quickly.
- Team morale: Regular wins, autonomy, clear priorities.
- Flexibility: Accommodate changing requirements without starting over.
- Master the Agile Ceremonies: Sprint Planning (commit to work) → Daily Standup (sync) → Sprint Review (demo) → Sprint Retrospective (improve).
- Velocity is Your Forecasting Tool: Average story points per sprint. Formula: Remaining Points ÷ Velocity = Estimated Sprints to Completion.
- Track Progress with Charts: Burndown (remaining vs. time), Burnup (completed vs. time), Velocity (points/sprint), Throughput (items/sprint), Cumulative Flow Diagram (bottleneck identification).
- Definition of Ready (DoR) & Definition of Done (DoD): DoR ensures stories are well-defined before commitment; DoD ensures consistent quality standards across all sprints.
- Agile Advantages: Faster feedback loops, early risk detection, team morale through incremental wins, and flexibility to adapt to changing requirements.
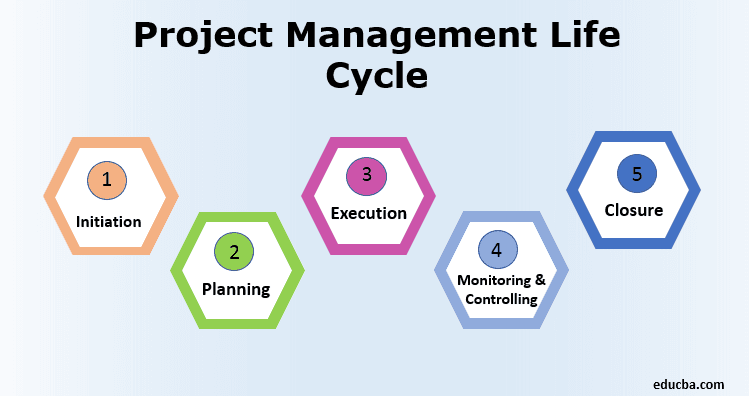
Domain 2: Project Life Cycle Phases (30%)#
Every project progresses through five distinct phases: Initiation (authorize and define scope), Planning (establish baselines and create schedules), Execution (deliver work and manage team), Monitoring & Controlling (track performance and manage changes), and Closing (finalize and capture lessons learned).
Initiation Phase#
Defines high‑level goals, feasibility, and stakeholders; results in the Project Charter.
- Charter categories: General Info, Project Vision, Organization, Implementation Overview.
Planning Phase#
Establishes scope, schedule, and cost baselines. Includes comprehensive planning across all knowledge areas.
Scope Management
Scope management ensures the project is completed with only authorized work and includes all necessary deliverables.
Scope Management Processes:
- Plan Scope Management → Define how scope will be managed and validated.
- Collect Requirements → Gather detailed functional and non-functional requirements from stakeholders.
- Define Scope → Create a formal scope statement defining project boundaries, deliverables, constraints.
- Create WBS → Decompose scope into manageable work packages (see below).
- Validate Scope → Obtain formal acceptance of deliverables from stakeholders.
- Control Scope → Manage scope changes through formal change control process.
Scope Creep Prevention:
- Establish clear scope statement early.
- Use Requirements Traceability Matrix (RTM) to link requirements to deliverables.
- Implement strict change control process.
- Communicate with stakeholders about impacts of scope changes.
- Build a solid Scope Baseline before estimating: The Scope Statement + WBS + WBS Dictionary form the foundation for all planning activities.
- Link Requirements to Deliverables: Use the Requirements Traceability Matrix (RTM) to connect each requirement to a deliverable and test case—this prevents scope creep by documenting what's included.
- Protect Your Baseline: Once the Scope Baseline is approved, implement strict change control. Every scope change impacts schedule and cost.
Work Breakdown Structure (WBS)
A hierarchical decomposition of deliverables into manageable work packages.
Together, the Scope Statement, WBS, and WBS Dictionary form the Scope Baseline.
Decompose Scope → WBS (work packages) → Activities before estimating or sequencing.
Estimating Techniques
Work packages from the WBS are further decompossed into activities.
| Technique | Description | Use Case |
|---|---|---|
| Analogous | Uses historical data from similar projects. | When limited detail exists (least accurate). |
| Parametric | Uses formulas/statistical relationships (simple calculations). | When variables are measurable. |
| Three‑Point | Uses the most likely, optimistic, and pessimistic values in a forumula ((O+ML+P)/3). | When uncertainty is high. |
| Bottom‑Up | Every component is determined and then totalled. | When WBS is complete (most accurate). |
Effort - The amount of work required to complete the activity.
Duration - Takes into account the resources allocated to the task.
Elapsed Time - Takes into account the amount of work which can be done each day of the week.
By adding 'Contingency reserves' or 'buffers' we are building in extra time to our activity estimates in case things don't go as planned!
Dependencies & Relationships
| Dependency Type | Description |
|---|---|
| Mandatory (Hard Logic) | Must occur in a set order (e.g., walls before roof). |
| Discretionary (Preferred Logic) | Team choice/best practice. |
| External | Depends on outside parties (e.g., permits). |
| Internal | Controlled within the team. |
| Relationship | Description |
|---|---|
| Finish‑to‑Start (FS) | Successor starts after predecessor finishes (most common). |
| Start‑to‑Start (SS) | Activities may start together. |
| Finish‑to‑Finish (FF) | Activities finish together. |
| Start‑to‑Finish (SF) | Rare: successor must start before predecessor can finish. |
Scheduling Tools
| Tool | Purpose |
|---|---|
| Precedence Diagramming Method (PDM) | Network diagram with nodes and dependency arrows. |
| PERT Chart (Program Evaluation and Review Technique) | Network diagram that uses three‑point estimates to evaluate duration and uncertainty. |
| Gantt Chart | Timeline view of tasks and durations. |
| Milestone Chart | Zero‑duration checkpoints. |
| Critical Path Method (CPM) | Longest path of dependent tasks; defines total duration. |
| Float/Slack | Time a task can slip without delaying the finish date. |
Precedence Diagramming Method (PDM) Example
A PDM diagram displays project tasks as nodes (boxes) with dependency arrows connecting them. This network diagram format makes it easy to see task sequences, identify dependencies, and visualize the overall project workflow. PDM is the foundation for other network-based scheduling tools and critical path analysis.
Gantt Chart Example
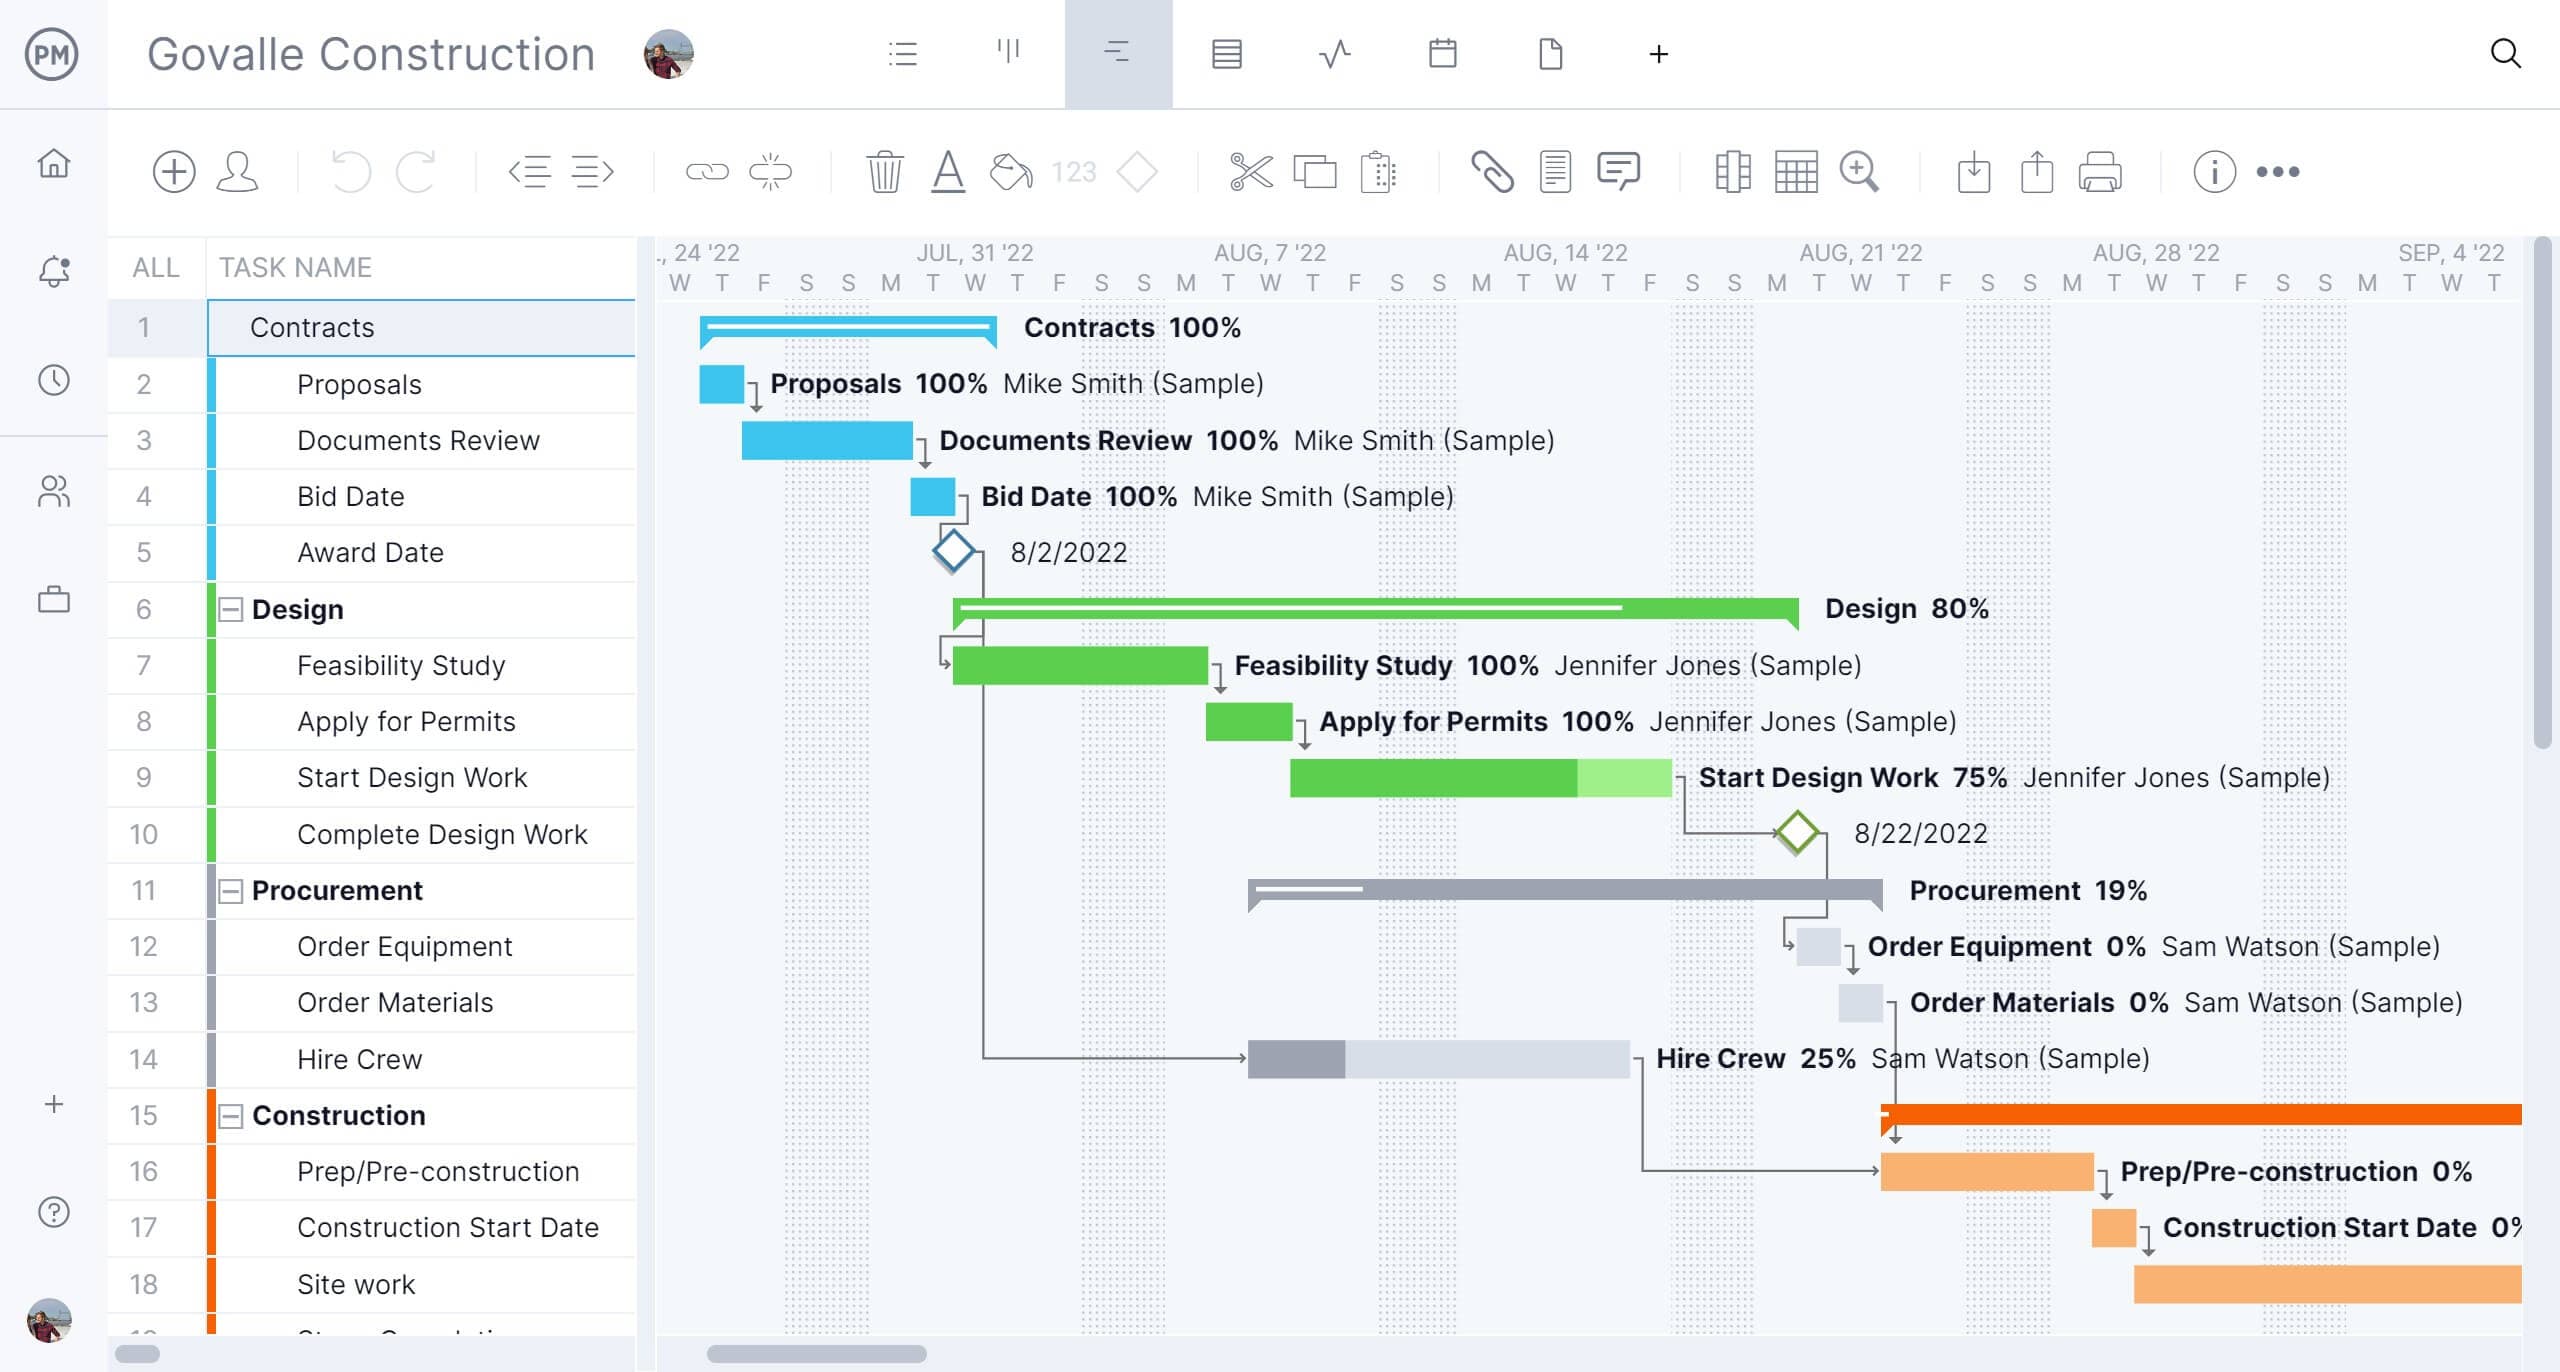
A Gantt chart displays project tasks as horizontal bars along a timeline. Each bar represents a task's duration, dependencies are shown with connecting lines, and the chart clearly visualizes the overall project schedule. This is one of the most popular tools for communicating project timelines to stakeholders.
PERT Chart Example
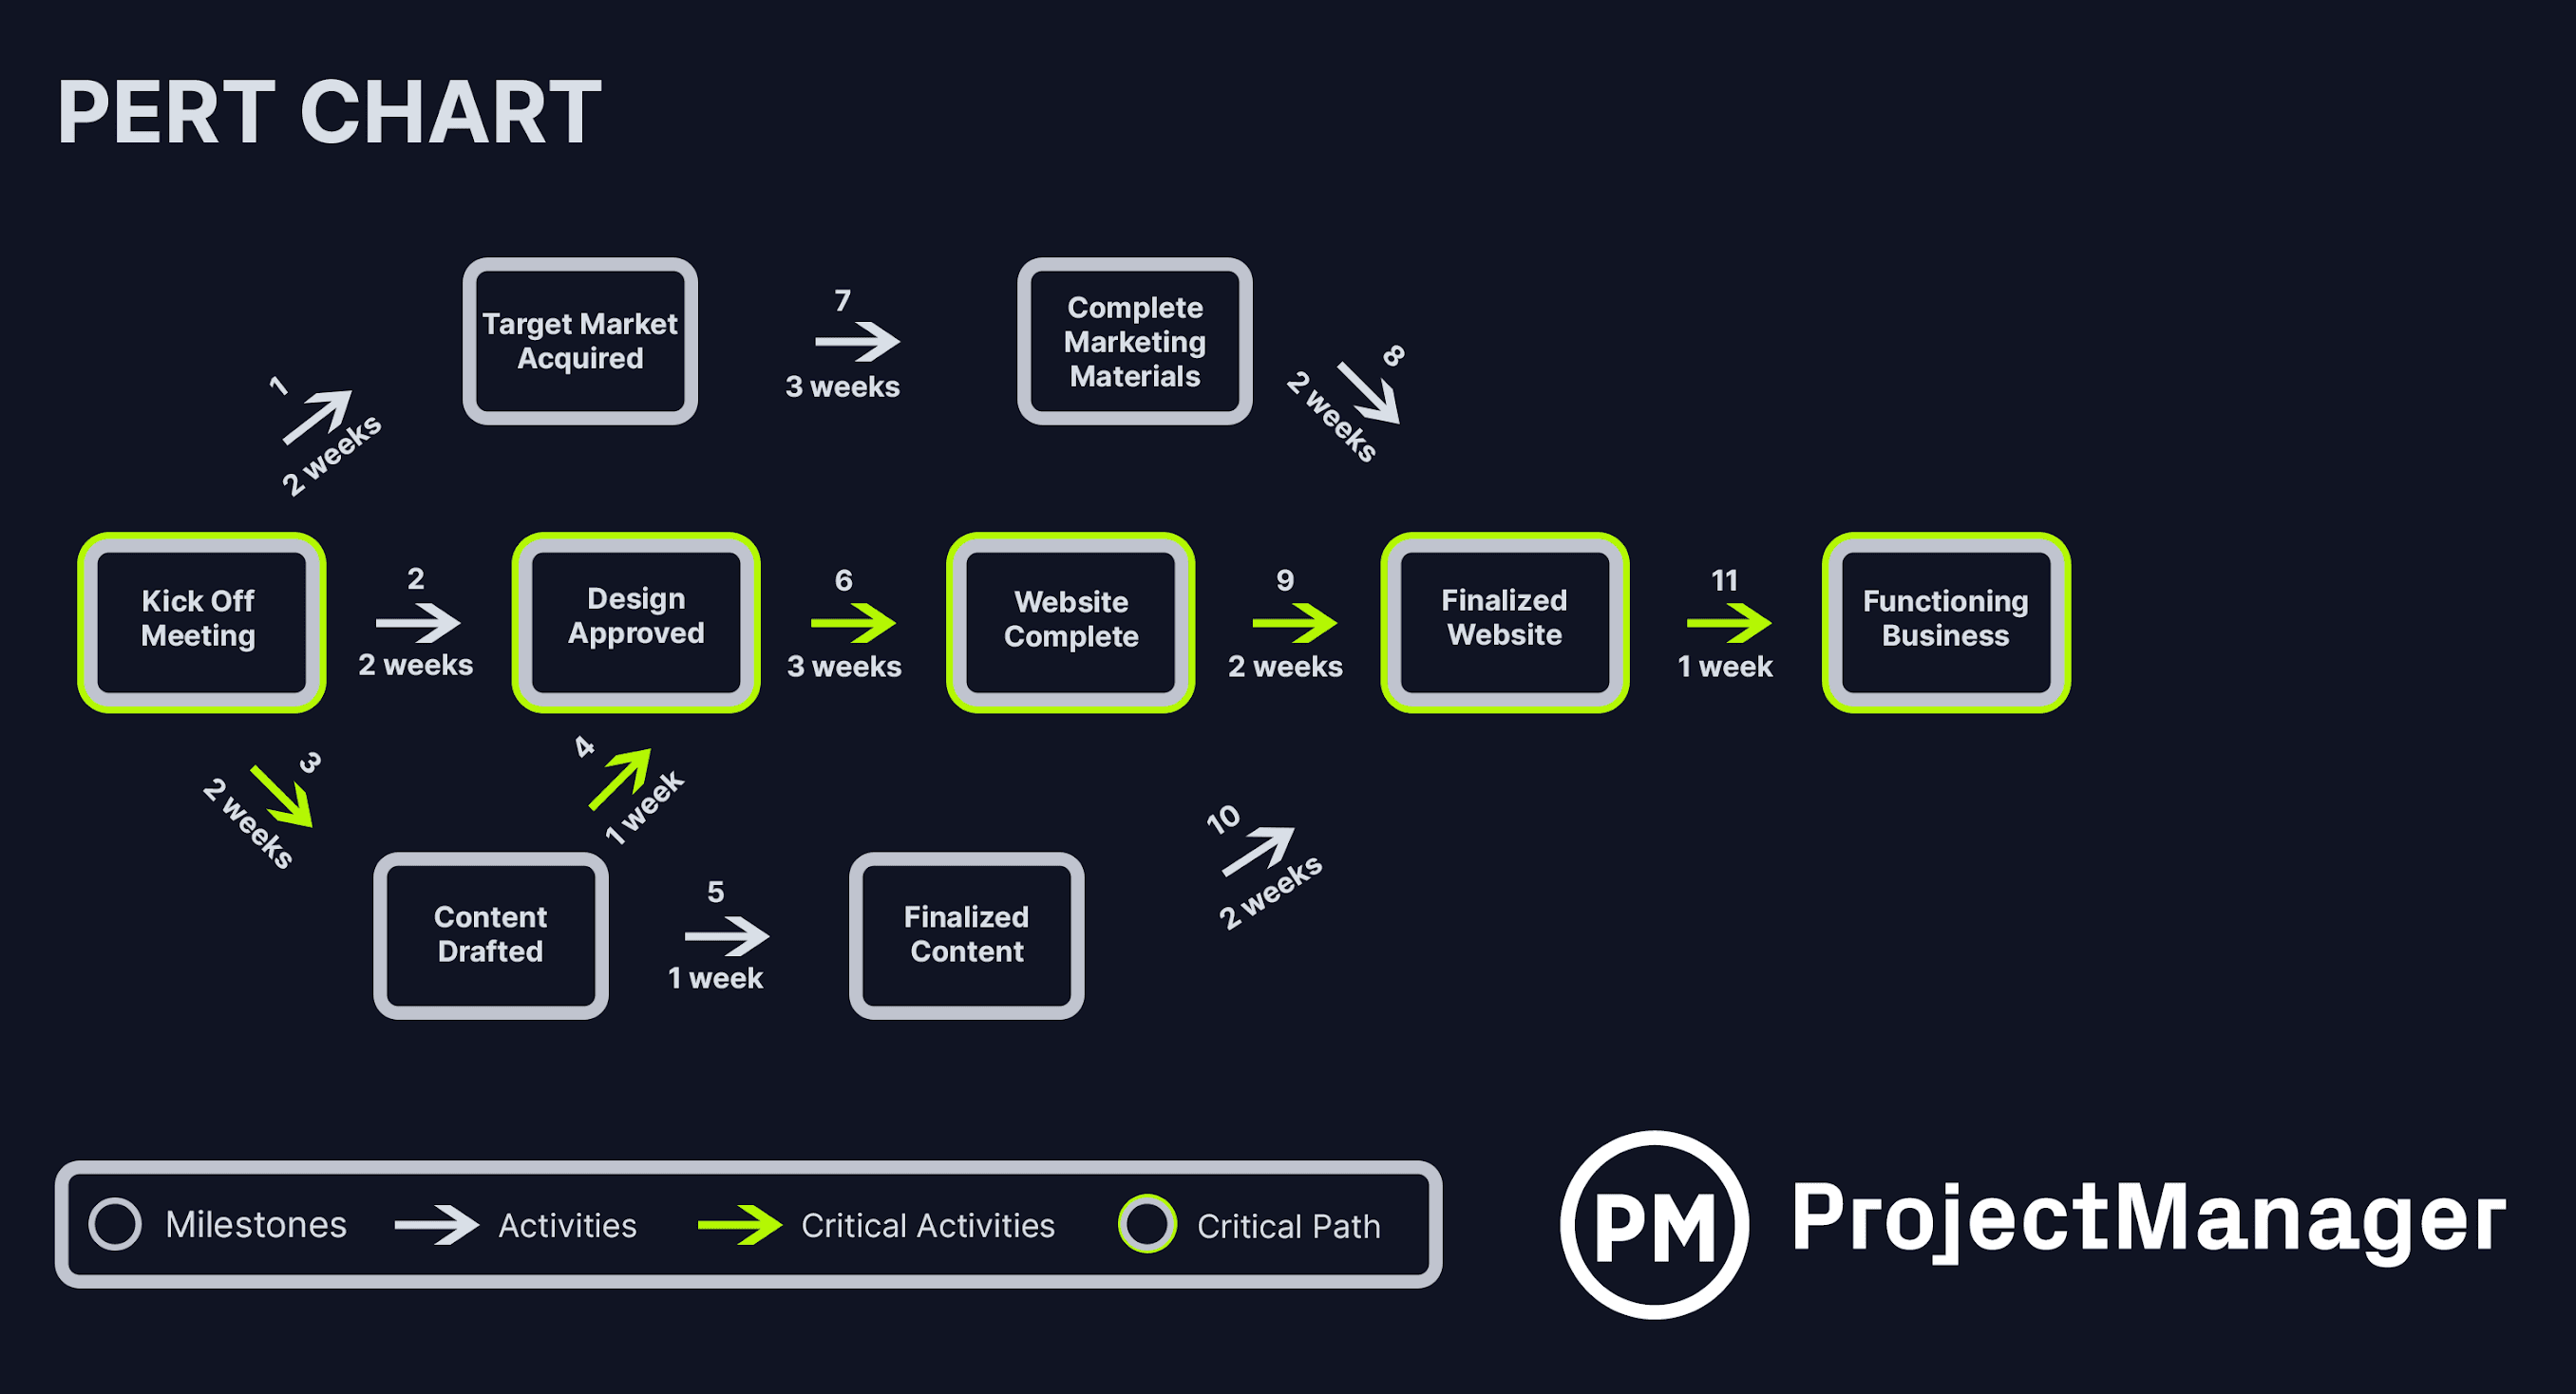
A PERT (Program Evaluation and Review Technique) chart displays tasks as nodes with dependency arrows connecting them. It shows the sequence and relationships between activities, making it easy to identify the critical path. PERT charts are particularly useful when dealing with uncertainty and three-point estimates (Optimistic, Most Likely, Pessimistic).
Milestone Chart Example
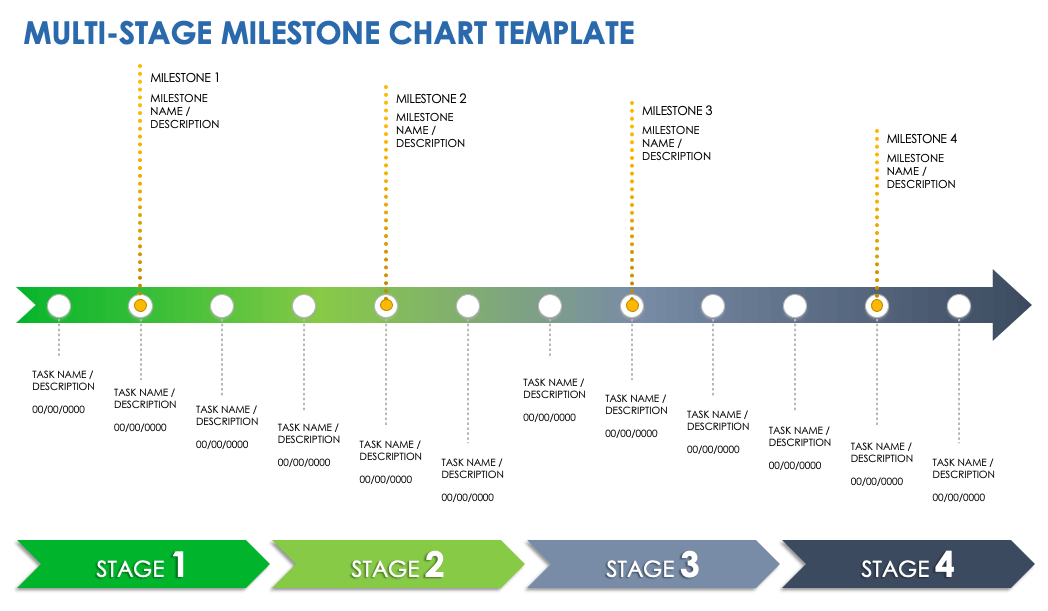
A milestone chart highlights key checkpoints and deliverables at specific points in the project timeline. Milestones are zero-duration events that represent significant achievements, approvals, or decision points. They're excellent for communicating major project gates to stakeholders and executives.
Critical Path Method (CPM) Example
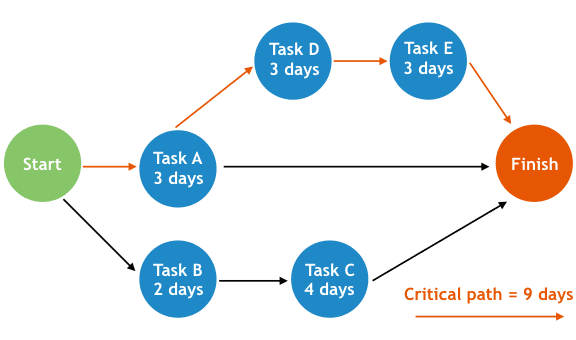
The Critical Path Method identifies the longest sequence of dependent tasks that determines the project's total duration. Tasks on the critical path have zero float—any delay in these tasks delays the entire project. By understanding the critical path, project managers can focus resource optimization and risk mitigation efforts where they have the most impact. Non-critical path tasks have slack/float and can be delayed without affecting the project finish date.
Cost Estimation & Reserves
- Cost Baseline: Approved, time‑phased budget excluding management reserves.
- Contingency Reserves: Inside the baseline for known risks ("known unknowns").
- Management Reserves: Outside the baseline for unforeseen work ("unknown unknowns").
Risk Management
Risk management is critical in all project phases. It involves identifying, analyzing, and responding to project risks to protect objectives.
Risk Management Process:
- Plan Risk Management → Define risk strategy and processes.
- Identify Risks → Gather potential risks using brainstorming, expert judgment, historical data.
- Perform Qualitative Risk Analysis → Assess probability and impact using:
- Probability-Impact Matrix: Maps risks by likelihood and consequence.
- Risk Rating: (Probability × Impact) determines priority.
- Perform Quantitative Risk Analysis → Numerical analysis using Monte Carlo simulations, expected monetary value (EMV).
- Plan Risk Responses → Define actions:
- Avoid: Eliminate the risk (e.g., change scope).
- Mitigate: Reduce probability or impact.
- Transfer: Shift risk to third party (insurance, outsourcing).
- Accept: Acknowledge and budget for it.
- Monitor & Control Risks → Track triggers, effectiveness, new risks.
Risk Register: Documents risk ID, description, probability, impact, response strategy, owner, and status.
Negative vs. Positive Risks:
- Negative Risks (Threats): Adverse events; use Avoid, Mitigate, Transfer, Accept.
- Positive Risks (Opportunities): Beneficial events; use Exploit, Enhance, Share, Accept.
Stakeholder Management
Stakeholders are individuals or groups impacted by or able to impact the project. Effective stakeholder management ensures alignment and support.
Key Stakeholder Roles:
| Role | Description |
|---|---|
| Sponsor | The person, group, or organization paying for the project. May be the customer. Accountable for enabling success—they secure budget, remove roadblocks, and ensure organizational support. The sponsor is often the highest-priority stakeholder. |
Stakeholder Identification & Analysis:
- Power/Interest Grid: Classify stakeholders as Manage Closely (high power, high interest), Keep Satisfied (high power, low interest), Keep Informed (low power, high interest), Monitor (low power, low interest).
- Salience Model: Evaluate stakeholders by power, legitimacy, and urgency.
Engagement Strategies:
- Active Management: Regular communication and involvement for key stakeholders.
- Proactive Engagement: Anticipate concerns and address before escalation.
- Resistance Management: Identify and address sources of resistance early.
Stakeholder Register: Documents stakeholder names, interests, expectations, influence level, and engagement strategy.
Communication Management
Effective communication ensures timely, accurate information flow among all stakeholders.
Communication Planning:
- Identify communication needs (frequency, format, distribution).
- Create a Communication Matrix/Plan mapping:
- Who needs what information
- When and how often
- Format (status reports, meetings, dashboards)
- Responsible party
Communication Tools & Methods:
- Status Reports: Periodic updates on performance, risks, changes.
- Progress Meetings: Team synchronization and issue resolution.
- Dashboards: Real-time visibility into KPIs and metrics.
- Email/Notifications: Asynchronous updates for non-urgent information.
- Executive Summaries: High-level briefs for senior leadership.
Communication Barriers to Manage:
- Noise/interference in transmission.
- Feedback loops to verify understanding.
- Cultural and language differences.
- Information overload.
Meeting Management
Effective meetings are critical for project communication and team alignment. Poor meetings waste time and cause misalignment. Here are best practices for managing meetings:
Key Meeting Roles:
| Role | Responsibility |
|---|---|
| Facilitator | Leads the meeting and keeps discussion on track. Critical to the success of the meeting. Ensures objectives are met and decisions are made. |
| Scribe | Takes notes and documents action items. Should be identified in advance so they're prepared. |
| Target Audience | The right people attending—keep it relevant to avoid wasting time. |
Meeting Management Checklist: Use this framework to plan and execute effective meetings:
- ✓ Identify the meeting type — Status update, decision-making, brainstorming, retrospective, etc.
- ✓ Invite the right people — Include stakeholders with relevant authority, expertise, or interest. Avoid inviting people who don't need to attend.
- ✓ Send out an agenda — Share the agenda in advance so attendees can prepare.
- ✓ Identify roles — Clarify who is facilitating and who is scribing before the meeting starts.
- ☐ Keep to time — Respect everyone's time by starting and ending on schedule. Manage scope creep during the meeting.
- ☐ Stay on topic — Redirect side conversations back to the agenda. Document off-topic items for later discussion.
- ☐ Manage follow-ups — Document decisions, action items, owners, and due dates. Distribute notes promptly.
- Risk Management is Continuous: Identify → Analyze (Probability-Impact Matrix for qualitative; EMV/Monte Carlo for quantitative) → Plan Responses (Avoid, Mitigate, Transfer, Accept) → Monitor & Control.
- Quality Matters Throughout: QA (Quality Assurance) is proactive and prevents defects; QC (Quality Control) is reactive and detects them. Use tools like Run Charts, Control Charts, Fishbone Diagrams, Histograms, Pareto Charts, and Defect Logs.
- Manage Stakeholders Strategically: Use the Power/Interest Grid or Salience Model to classify stakeholders. Engage proactively to address resistance early. Build a Stakeholder Register documenting interests, expectations, and engagement strategies.
- Communicate Consistently: Create a Communication Matrix mapping who needs what, when, how often, and in what format. Use status reports, dashboards, progress meetings, and executive summaries—tailor communication to audience.
Schedule Optimization
| Technique | Description |
|---|---|
| Resource Loading | Fill team capacity with tasks based on availability. |
| Resource Leveling | Adjust schedule to resource limits (critical path may change). |
| Resource Smoothing | Balance work within available float only. |
| Fast‑Tracking | Overlap tasks on the critical path. |
| Crashing | Add resources to critical path tasks to shorten duration. |
- Build Defensible Schedules: Use PDM/PERT/Gantt/CPM with proper dependency and relationship types (FS, SS, FF, SF).
- Understand Float & Critical Path: Float (or Slack) is the time a task can slip without delaying the project. The critical path is the longest duration path—changes here impact the finish date.
- Optimize with Leveling/Smoothing: Resource Leveling adjusts schedules to resource constraints (critical path may change); Resource Smoothing balances work within available float only.
- Accelerate When Needed: Use Fast-Tracking (overlap tasks) or Crashing (add resources) to compress schedules—both have trade-offs and costs.
- Manage Resources Strategically: Plan → Allocate → Load → Level resources. Use RACI/RAM matrices to clarify accountability and prevent confusion.
Integration Management (Project Initiation & Execution)
Integration management ensures all project elements work together cohesively. It includes:
Develop Project Charter (Initiation):
- Authorizes the project and assigns a project manager.
- Documents high-level requirements, success criteria, and constraints.
- Inputs: Business case, contracts, organizational factors.
- Output: Project Charter (formal authorization).
Direct & Manage Project Work (Execution):
- Execute work according to the project management plan.
- Monitor work performance and generate status reports.
- Manage team communications and stakeholder interactions.
- Track actual vs. planned performance.
Monitor & Control Project Work (Monitoring):
- Collect, measure, and analyze work performance data.
- Compare against baselines to identify variances.
- Implement corrective/preventive actions as needed.
Close Project or Phase (Closing):
- Document lessons learned, project closure report.
- Archive project records and transfer deliverables.
- Release project resources.
- Conduct post-implementation review and stakeholder sign-off.
Execution Phase#
- Deliver work, manage team, and communicate.
- Use RACI/RAM to clarify accountability.
- Implement integration management practices for cohesive execution.
Monitoring & Controlling#
Compare planned vs. actual; use EVM (Earned Value Management) for cost/schedule control.
Quality and Resource Management#
Quality Management
Quality is the degree to which deliverables meet requirements and stakeholder expectations. Quality management occurs throughout the project, not just at the end.
Quality Planning Process:
- Define quality standards and acceptance criteria.
- Determine testing/inspection strategies.
- Identify tools and procedures for quality assurance/control.
Quality Assurance (QA) vs. Quality Control (QC):
- QA: Proactive process to prevent defects (process-focused).
- QC: Reactive inspection to detect defects (product-focused).
Quality and Performance Measurement Tools:
| Tool | Description |
|---|---|
| Run Chart | Displays data points in time order to show trends or patterns in project performance. Useful for identifying non-random variations over time. |
| Control Chart | Plots process performance data to identify whether variations are within acceptable limits. Used for monitoring quality stability. |
| Fishbone Diagram (Ishikawa Diagram) | A cause-and-effect diagram used to identify potential causes of a problem and categorize them. Helps in root cause analysis. |
| Histogram | A graphical display of data distribution that helps visualize frequency and variations of results. Often used to detect process inconsistencies. |
| Defect Log | Tracks identified defects with severity, status, and resolution actions. Critical for monitoring quality issues. |
| Pareto Chart | A bar chart ordered by frequency; highlights the "vital few" problems causing most defects (80/20 rule). |
Quality Metrics & KPIs:
- Defect Density: Number of defects per unit of code/deliverable.
- First-Pass Yield: Percentage of work completed correctly on first attempt.
- Rework Rate: Effort spent fixing defects vs. original effort.
- On-Time Delivery: Percentage of deliverables delivered on schedule.
- Budget Variance: Actual vs. planned costs.
Resource Management
Effective resource planning ensures the right people are assigned at the right time with appropriate skills. Resources go through a lifecycle that extends beyond the project itself.
Resource Life Cycle: Resources—especially physical assets like equipment and infrastructure—follow a predictable lifecycle:
- Acquisition: Obtain or purchase the resource (machines, vehicles, buildings, software licenses).
- Maintenance: Keep the resource operational and effective throughout its useful life. Includes updates, patches, repairs, and ongoing support.
- Hardware Decommissioning / End-of-Life Software: When a resource reaches the end of its useful life, it must be decommissioned responsibly (disposal, recycling, data destruction).
- Successor Planning: Plan for the next generation resource to replace the retiring one. This ensures continuity and prevents gaps in capability.
Understanding the resource lifecycle is critical for long-term project and operational planning. Don't acquire a resource without considering its maintenance costs and eventual replacement.
Resource Planning Steps:
- Identify Required Resources: Determine skills, roles, expertise needed.
- Resource Allocation: Assign team members to tasks based on availability and capability.
- Resource Loading: Assign work to team members up to their capacity.
- Resource Leveling: Resolve overallocation by adjusting schedules (critical path may change).
- Resource Smoothing: Adjust schedules within float to balance resource usage.
Resource Types:
- Labor: Team members with specific roles and skills.
- Equipment: Tools, machines, facilities required.
- Materials: Raw materials, components, supplies.
- Budget: Monetary resources allocated to tasks.
Resource Classifications: Understanding different resource classifications helps with planning, allocation, and risk management:
| Classification | Definition | Implication |
|---|---|---|
| Physical Resources | Tangible assets: materials, equipment, facilities. A capital resource is high-value and long-lived (machinery, vehicles, buildings). | Must plan acquisition, maintenance, and eventual replacement. Impacts budget and project timeline. |
| Dedicated Resource | Fully available to work on your project exclusively. | High availability but ties up organizational capacity. |
| Shared Resource | Split between your project and other projects or functional work. | Flexibility for the organization but scheduling conflicts may arise. Need clear communication on allocation. |
| Overallocated Resource | Has had too much work assigned (working >100% of capacity). | High risk of burnout, missed deadlines, quality issues. Adjust schedules or add resources. |
| Benched Resource | Available but not currently being used on the project. | Opportunity to utilize for upcoming work or re-allocate elsewhere. |
| Internal Resource | Employed (or owned) by your organization. | Easier to manage; less contractual complexity. Must still negotiate with functional managers. |
| External Resource | Acquired from outside your organization (vendors, contractors, consultants). | May cost more; requires contracts and clear SOWs. Good for specialized skills or temporary surge capacity. |
| Remote Resource | Geographically separated from the rest of the team. | Requires robust communication tools and processes; time zone considerations; may have collaboration challenges. |
| Core/Operational Team Member | On the project from start to finish. | Provides continuity and deep project knowledge. Essential for critical roles. |
| Functional/Extended Team Member | Joins the project for specialized tasks then leaves. | Cost-effective; brings specialized expertise. Requires clear handoff processes. |
Resource Management Artifacts:
- Resource Plan: Documents resource requirements, allocation strategy, and lifecycle considerations.
- Resource Histogram: Visual representation of resource usage over time.
- RACI/RAM Matrix: Clarifies accountability (Responsible, Accountable, Consulted, Informed).
- Project Team Directory: Names, roles, contact information, availability.
- Resource Calendar: Tracks resource availability and blackout dates (vacation, other projects).
EVM Metrics
Burn Rate
Definition: The rate at which project funds are being spent compared to work performed.
It helps determine whether the project is consuming its budget faster or slower than expected.
| Metric | Formula | Interpretation |
|---|---|---|
| Burn Rate | AC / EV | > 1 = Overspending, < 1 = Underspending, = 1 = On budget |
| Example: | If Actual Cost (AC) = 60,000 and Earned Value (EV) = 50,000 → Burn Rate = 1.2 → Overspending. |
A Burn Rate > 1.0 means the project is burning through funds faster than planned.
A Burn Rate < 1.0 indicates it’s using funds more efficiently.
| Budget Burndown Chart | Tracks remaining project budget versus time. It shows how quickly funds are being depleted and helps forecast whether the project will stay within budget. |
| Metric | Definition | Formula |
|---|---|---|
| PV (Planned Value) | Budgeted cost of scheduled work. | % Planned × BAC |
| EV (Earned Value) | Budgeted value of completed work. | % Complete × BAC |
| AC (Actual Cost) | Actual costs incurred to date. | — |
| CV (Cost Variance) | Budget variance. | EV − AC |
| CPI (Cost Performance Index) | Cost efficiency. | EV ÷ AC |
| SV (Schedule Variance) | Schedule variance. | EV − PV |
| SPI (Schedule Performance Index) | Schedule efficiency. | EV ÷ PV |
CPI < 1 ⇒ Over Budget; SPI < 1 ⇒ Behind Schedule.
- Know Your Budget Layers: Cost Baseline (approved, time-phased budget) vs. Contingency Reserves (known risks, inside the baseline) vs. Management Reserves (unknown unknowns, outside the baseline).
- Master the EVM Metrics: PV (planned cost), EV (earned value), AC (actual cost), CV (budget variance: EV − AC), CPI (efficiency: EV ÷ AC), SV (schedule variance: EV − PV), SPI (schedule efficiency: EV ÷ PV).
- Remember the Rules: CPI < 1 means you're over budget; SPI < 1 means you're behind schedule. CPI and SPI > 1 = healthy.
- Burn Rate Formula: AC ÷ EV tells you how fast you're consuming budget. > 1 = overspending; < 1 = underspending; = 1 = on track.
Change Control Process (12 Steps)#
- Create/receive change request → 2) Log it → 3) Preliminary review → 4) Assess impact → 5) Document recommendation → 6) Identify decision‑makers → 7) Escalate to CCB (Change Control Board) as needed → 8) Document/communicate status → 9) Update plan/baseline → 10) Implement → 11) Validate implementation → 12) Communicate deployment.
The CCB reviews high‑impact changes to protect baselines.
- Protect Your Baselines: Formal Change Control Process and the Change Control Board (CCB) exist to safeguard scope, schedule, and cost baselines from unauthorized creep.
- 12-Step Change Control Process: Create/Log → Preliminary Review → Assess Impact → Document Recommendation → Identify Decision-Makers → Escalate to CCB → Document/Communicate Status → Update Plan/Baseline → Implement → Validate Implementation → Communicate Deployment.
- Document Everything: Every change must be tracked, evaluated for impacts, and either approved or rejected. The CCB is the gatekeeper—decisions must be documented and communicated to stakeholders.
Domain 3: Tools and Documentation (19%)#
Procurement Management#
Procurement management ensures the project acquires goods and services from external sources efficiently and effectively.
Procurement Processes:
- Plan Procurement Management → Define procurement strategy and approach.
- Conduct Procurements → Solicit proposals from vendors using RFI, RFP, RFB, RFQ.
- Select Vendors → Evaluate proposals and award contracts.
- Administer Contracts → Manage vendor relationships and contract performance.
- Close Procurements → Finalize contracts and archive records.
Make-vs-Buy Analysis:
| Type | Description | Cost Factor |
|---|---|---|
| Build/Make | Create internally. | Higher labor cost, longer timeline, quality control. |
| Buy | Purchase an item or solution. | Higher material cost, shorter timeline, proven solution. |
| Lease | Rent rather than buy. | Ongoing costs, flexibility, no ownership. |
| Subscription / Pay‑as‑you‑go | Ongoing service payments (e.g., cloud). | Scalability, predictable costs, no maintenance burden. |
Procurement & Vendor Documents#
| Document | Purpose |
|---|---|
| Request for Information (RFI) | Gathers vendor info when solutions vary. |
| Request for Proposal (RFP) | Announces a project and solicits proposals. |
| Request for Bid (RFB) | Competitive bids for commodities with clear specs. |
| Request for Quote (RFQ) | Price quotes for defined goods/services. |
Vendor Contract Types#
Fixed‑Price (FP) Contracts
Vendor bears risk; best for well‑defined scope.
| Type | Description |
|---|---|
| Firm Fixed Price (FFP) | Price fixed at outset and won't change unless scope changes. Highest risk to vendor. |
| Fixed Price Incentive Fee (FPIF) | Fixed price plus bonus/incentive if performance targets are met. |
| Fixed Price with Economic Price Adjustments (FPEPA) | Fixed price with adjustments to cover cost changes (e.g., currency exchange rates, commodity cost fluctuations like oil). |
Cost‑Plus (CP) Contracts
Buyer pays actual costs plus a fee/incentive. Lower risk to vendor, higher risk to buyer.
| Type | Description |
|---|---|
| Cost Plus Fixed Fee (CPFF) | Buyer reimburses all actual costs incurred, then pays a fixed fee upon completion. |
| Cost Plus Incentive Fee (CPIF) | Buyer reimburses all actual costs, plus a bonus/incentive if performance targets are met. |
| Cost Plus Award Fee (CPAF) | Buyer reimburses all actual costs, plus a performance-based bonus awarded at buyer's discretion based on subjective evaluation. |
Time & Materials (T&M) Contracts
| Type | Description |
|---|---|
| Time & Materials | Work billed at an agreed hourly rate ("unit price") plus materials at cost. Flexible for scope changes; higher risk to buyer if scope creeps. |
- FFP: Highest vendor risk; lowest buyer risk. Use when scope is well-defined.
- FPIF/FPEPA: Balanced risk with incentives.
- CPFF/CPIF/CPAF: Lower vendor risk; higher buyer risk. Use when scope is uncertain or evolving.
- T&M: Most flexible; highest buyer risk. Use for exploratory work or when scope is truly unpredictable.
- Know the Procurement Sequence: Plan → Conduct (issue RFI/RFP/RFB/RFQ) → Select Vendors → Administer Contracts → Close.
- Match Contract Types to Scope: Fixed-Price contracts shift risk to the vendor (good when scope is clear). Cost-Plus contracts shift risk to the buyer (better when scope is uncertain). Time & Materials is most flexible but highest risk to buyer.
- Document Everything: Master the legal documents—SOW/TOR (what you're buying), NDA (protect secrets), MSA (umbrella agreement), SLA (service expectations), PO (official order), Warranty (guarantee), LOI (intent, not binding), MOU (informal understanding), Maintenance Agreement (ongoing support).
Legal & Contract Documents#
| Document | Purpose |
|---|---|
| Statement of Work (SOW) | The details of the services or goods we want to purchase, so that the vendor knows what we're asking them to provide. Similar to TOR. |
| Terms of Reference (TOR) | The description of the work requirement including the scope, timeline, resources, etc. Similar to SOW. |
| Non‑Disclosure Agreement (NDA) | Ask your vendor to sign an NDA if they'll be exposed to sensitive information or trade secrets that you don't want shared outside of your organisation. |
| Cease & Desist Letter | Used to stop (cease) somebody doing something immediately and never again (desist). For example, if they are violating a copyright or patent. |
| Memorandum of Understanding (MOU) | Not legally enforceable, but might be useful for outlining terms when it's not possible to create a legal agreement between parties. |
| Letter of Intent (LOI) | Describes the intention of what the buyer and vendor are going to do, usually before they enter a contract. Not always legally binding, but can carry weight. |
| Master Service Agreement (MSA) | A kind of umbrella agreement to set general terms between parties, which can help streamline future contracts. |
| Service Level Agreement (SLA) | Defines expectations of the level of service provided by the vendor (for example, how quickly issues will be responded to). |
| Maintenance Agreement | Describes what the vendor is expected to do in order to keep the goods or service you purchased up and running. |
| Purchase Order (PO) | The official document issued by buyer to commit to pay the vendor for the sale of the specified products or services. |
| Warranty | The vendor's guarantee that the product will perform as expected for a specified period of time. |
Core Project Artifacts#
| Artifact | Description |
|---|---|
| Requirements Traceability Matrix (RTM) | Associates requirements to deliverables and tests. |
| Responsibility Assignment Matrix (RAM/RACI) | Clarifies who is Responsible, Accountable, Consulted, Informed. |
| Risk Register | Probabilities, impacts, and responses for risks. |
| Issue Log | Tracks issues and resolutions. |
| Change Log | Records change requests and decisions. |
| Milestone Chart | Major goals and checkpoints. |
| Project Roadmap | High‑level summary of outcomes over time. |
Domain 4: Basics of IT and Governance (18%)#
Governance Frameworks#
Governance frameworks provide structured approaches to managing IT resources, services, and risks within an organization. Each framework addresses different aspects of IT management and organizational control.
| Framework | Focus | Key Areas |
|---|---|---|
| COBIT (Control Objectives for Information & Related Technology) | IT governance and control; aligns IT strategy with business objectives. | Governance, Risk Management, Compliance. |
| ITIL (Information Technology Infrastructure Library) | Service management best practices for IT operations and support. | Service Design, Service Delivery, Incident Management, Change Management. |
| ISO/IEC 27001 | Information security management systems and controls. | Asset Management, Access Control, Cryptography, Incident Management. |
| NIST (National Institute of Standards & Technology) | Security frameworks and guidelines for protecting information systems. | Cybersecurity Framework, Risk Management Framework (RMF), NIST SP 800-53 controls. |
Governance Structure#
Governance is organized in a hierarchical structure that cascades from strategic policies down to operational guidelines.
| Level | Description | Example |
|---|---|---|
| Policies | High‑level, organization‑wide rules and mandates; executive‑level decisions. | "All data must be encrypted in transit and at rest." |
| Standards | Required technical specifications and baselines that enforce policies. | "Use AES-256 encryption for sensitive data." |
| Procedures | Step‑by‑step instructions for how to implement standards. | "Follow the data encryption deployment procedure in Section 3.2." |
| Guidelines | Recommended best practices and suggestions (not mandatory). | "Consider data loss prevention (DLP) solutions for added protection." |
Governance Roles & Responsibilities#
| Role | Responsibility |
|---|---|
| Project Management Office (PMO) | Establishes governance standards, templates, processes, and reporting frameworks. Provides oversight and ensures compliance with organizational standards. |
| Change Control Board (CCB) | Reviews and approves or rejects high‑impact changes to protect baselines (scope, schedule, cost). Ensures proper change management discipline. |
ESG Factors: Environmental, Social, & Governance#
ESG represents a broader organizational consideration beyond IT governance, reflecting how companies manage risks and opportunities related to sustainability and social responsibility.
Environmental (E):
- Carbon footprint reduction from IT operations (data center efficiency, cloud migration).
- Energy consumption and renewable energy usage.
- E-waste management and hardware recycling programs.
Social (S):
- Data privacy and protection (respecting user data rights).
- Diversity and inclusion in IT hiring and team composition.
- Community engagement and corporate social responsibility initiatives.
Governance (G):
- Board oversight and executive accountability.
- Ethical IT practices and anti-corruption measures.
- Compliance with regulations and industry standards.
Projects increasingly must consider ESG impacts—choosing sustainable vendors, ensuring data privacy in system designs, and promoting ethical practices throughout the project lifecycle.
Information Security Concepts#
Information security is critical in IT governance and project management. It operates across three dimensions: physical, operational, and digital security.
Physical Security
Protects hardware and facilities from unauthorized access, theft, or damage.
Key Controls:
- Mobile Device Management (MDM): Control and monitor company mobile devices, enforce encryption, remote wipe capabilities.
- Removable Media Controls: Restrict USB drives, external hard drives, and portable storage to prevent data theft.
- Facility Access Controls: Badge systems, visitor logs, biometric authentication to limit unauthorized entry to server rooms and sensitive areas.
- Video Surveillance & Monitoring: Security cameras in critical areas.
Operational Security
Manages people-based security through policies and screening.
Key Controls:
- Background Screening: Conduct background checks on employees with access to sensitive data or systems.
- Security Clearances: For government contracts or classified work, employees may require formal security clearances.
- Separation of Duties: No single person controls all aspects of a critical transaction (e.g., requisition, approval, receipt).
- Least Privilege Principle: Assign only the minimum permissions needed to perform a role.
Digital Security
Protects systems and data through technical controls.
Key Controls:
- Access Controls & Permissions: Role-based access control (RBAC), attribute-based access control (ABAC).
- Remote Access Restrictions: VPN requirements, multi-factor authentication (MFA) for remote workers.
- Multi-Factor Authentication (MFA): Combines something you know (password), something you have (token/phone), or something you are (biometric).
- Data Classification & Need-to-Know: Classify data by sensitivity (Public, Internal, Confidential, Restricted) and grant access only to those with a business need.
Remember the three pillars of information security: Physical (facilities, devices), Operational (people, processes), and Digital (systems, access). Projects must consider all three to ensure comprehensive security.
Compliance and Privacy#
Organizations must comply with various legal and regulatory frameworks to protect customer data and avoid penalties.
Data Confidentiality & Classification
- Personally Identifiable Information (PII): Information that can identify an individual (name, SSN, email, address, phone number).
- Protected Health Information (PHI): Health records covered by HIPAA (in the U.S.).
- Data Classification: Organize data by sensitivity level to determine protection requirements.
- Public: No confidentiality concerns.
- Internal: For employee/organizational use only.
- Confidential: Restricted to authorized personnel; disclosure could harm the organization.
- Restricted: Highest sensitivity; PII, PHI, trade secrets; strict access controls required.
Global & Regional Compliance Regulations
| Regulation | Scope | Requirements |
|---|---|---|
| GDPR (General Data Protection Regulation) | European Union | Protects EU citizen data; requires explicit consent, data subject rights (access, deletion), breach notification within 72 hours. |
| HIPAA (Health Insurance Portability & Accountability Act) | United States (Healthcare) | Protects patient health information (PHI); requires administrative, physical, and technical safeguards. |
| CCPA (California Consumer Privacy Act) | California, USA | Grants consumers rights to know, delete, and opt-out of data sales. |
| SOX (Sarbanes-Oxley Act) | United States (Public Companies) | Requires financial controls and IT system reliability to ensure accurate financial reporting. |
| PCI-DSS (Payment Card Industry Data Security Standard) | Global (Payment Processing) | Protects credit card data; requires encryption, access controls, regular audits. |
| NIST (SP 800-53, RMF) | United States (Federal Agencies) | Security controls framework for federal information systems. |
Non-compliance with GDPR can result in fines up to €20 million or 4% of annual revenue. HIPAA violations can incur fines up to $1.5 million per violation category. Ensure projects include compliance requirements in scope and risk management.
Industry & Jurisdiction-Specific Compliance
- Financial Services: Comply with SEC, FINRA, and central bank regulations for data security and audit trails.
- Government Contracts: May require NIST SP 800-53 compliance, security clearances, and export control compliance.
- Healthcare: HIPAA (U.S.), GDPR (EU), provincial privacy laws (Canada).
- Country/State-Specific Laws: Some countries require data residency (data must stay within borders) or restrict certain technologies.
IT Infrastructure Concepts#
Understanding IT infrastructure is essential for project managers planning technology solutions. Infrastructure spans computing services, storage, networking, and software systems.
Computing Services & Models
Traditional (On-Premises):
- Physical servers managed by internal IT teams.
- Higher capital costs (CapEx), full control, compliance with data residency laws.
Cloud Service Models:
| Model | Definition | Examples | Best For |
|---|---|---|---|
| IaaS (Infrastructure as a Service) | Virtualized computing resources over the internet (VMs, storage, networking). | AWS EC2, Microsoft Azure VMs, Google Compute Engine. | Organizations wanting to avoid physical server management. |
| PaaS (Platform as a Service) | Development and deployment platform with middleware, databases, development tools. | Heroku, AWS Lambda, Google App Engine. | Developers building applications without managing infrastructure. |
| SaaS (Software as a Service) | Fully managed software applications delivered via web browser. | Salesforce, Microsoft 365, Slack, Zoom. | End-users accessing business applications without installation. |
| XaaS (Everything as a Service) | Umbrella term for any IT service delivered via cloud. | DaaS (Desktop), DBaaS (Database), AI/ML services. | Specific specialized services. |
- Use IaaS if your team wants to manage applications and operating systems.
- Use PaaS if developers need a platform without infrastructure overhead.
- Use SaaS for business applications where vendors handle everything.
Multi-Tiered Architecture
Most enterprise applications use a three-tier architecture to separate concerns:
| Tier | Purpose | Components |
|---|---|---|
| Presentation Tier (UI) | User interface and user experience. | Web browsers, mobile apps, desktop clients. |
| Application Tier (Business Logic) | Core application logic and business rules. | Application servers, APIs, microservices. |
| Data Tier (Database) | Persistent data storage and retrieval. | Databases, data warehouses, storage systems. |
Benefits: Scalability (add servers to each tier independently), maintainability, security (isolate layers), and disaster recovery.
Networking & Storage
Networking:
- Local Area Network (LAN): Internal company network.
- Wide Area Network (WAN): Connects geographically dispersed locations.
- Virtual Private Network (VPN): Encrypted connection for secure remote access.
- Bandwidth: Network capacity; measured in Mbps/Gbps.
Storage:
- File Storage: Traditional file systems (shared drives, NAS).
- Object Storage: Cloud storage for unstructured data (S3, Azure Blob).
- Block Storage: Raw storage for databases and high-performance needs (EBS, Azure Disk).
- Data Warehouse: Centralized repository for data analytics (Snowflake, Redshift, BigQuery).
Key Software Systems
| System | Purpose |
|---|---|
| ERP (Enterprise Resource Planning) | Integrates finance, HR, supply chain, manufacturing across the organization. |
| CRM (Customer Relationship Management) | Manages customer interactions, sales pipelines, and marketing. |
| EDRMS (Electronic Document Records Management System) | Stores, organizes, and manages enterprise documents and records. |
| CMS (Content Management System) | Publishes and manages digital content (websites, blogs, media). |
| Database Management Systems (DBMS) | Stores and retrieves structured data (SQL, NoSQL). |
| Financial Systems | Accounting, budgeting, procurement, and general ledger management. |
Operational Change Control Processes#
Change management is critical in IT operations to minimize risk and maintain system stability. Two primary change types exist: IT infrastructure changes and software changes.
IT Infrastructure Change Control
Infrastructure changes affect servers, networks, storage, and data centers. They require careful planning and coordination.
Key Considerations:
- Maintenance Windows: Scheduled times for changes (typically off-hours or weekends) to minimize user impact.
- Downtime Notifications: Communicate planned maintenance to users in advance.
- Rollback Plans: Procedures to revert changes if issues occur; ensures quick recovery.
- Validation Checks: Post-implementation testing to confirm the change succeeded.
- Change Advisory Board (CAB): Reviews high-risk changes before implementation.
Example Workflow:
- Submit change request (what, when, why, impact, rollback plan).
- Review by CAB or change manager.
- Schedule during maintenance window.
- Execute with validation and monitoring.
- Rollback immediately if issues detected.
- Document and close.
Software Change Control
Software changes include code releases, patches, updates, and deployments. This process is more iterative in Agile environments but maintains the same control principles.
Software Change Workflow:
- Requirements Definition: Clear understanding of what functionality is being added or fixed.
- Risk Assessment: Evaluate impact on existing systems, users, and performance.
- Testing: Unit testing, integration testing, user acceptance testing (UAT) in staging environment.
- Approval: Release approval from product owner, release manager, or CCB.
- Customer Notification: Inform stakeholders of new features/changes and expected deployment date.
- Release: Deploy to production during scheduled maintenance window.
- Monitoring & Support: Monitor system health post-release; support team ready for issues.
Continuous Integration/Continuous Deployment (CI/CD)
Modern DevOps practices automate software change control through CI/CD pipelines.
CI (Continuous Integration):
- Developers commit code frequently (multiple times per day).
- Automated tests run immediately on each commit.
- Merges to main branch only if tests pass.
- Early detection of integration issues.
CD (Continuous Deployment):
- Validated code automatically deploys to production (or staging/pre-prod).
- Reduces manual approval bottlenecks; increases deployment frequency.
- Requires robust automated testing and monitoring.
- Enables rapid iteration and rollback capability.
Production vs. Staging Environments
| Environment | Purpose | Users | Risk Level |
|---|---|---|---|
| Production (Prod) | Live system serving real end-users and customers. | All users; real data. | High — Issues directly impact business. |
| Staging (Stage/UAT) | Pre-production copy mirroring production setup. | QA teams, select end-users (acceptance testing). | Low — Safe to test changes; realistic environment. |
| Development (Dev) | Development environment for coding and unit testing. | Developers only. | Very Low — Broken code acceptable; development workspace. |
Best Practice: Always test changes in Staging before promoting to Production.
DevSecOps: Integrating Security into Change Control
DevSecOps extends DevOps by embedding security checks throughout the CI/CD pipeline:
- Security Scanning: Automated vulnerability scans on code and dependencies.
- Compliance Checks: Verify changes meet security policies (encryption, access controls).
- Threat Modeling: Assess security risks of new features before development.
- Approval Gates: Security team reviews changes before production release.
- Plan Infrastructure Changes Carefully: Maintenance windows, rollback plans, stakeholder notifications, and validation checks are essential.
- Master the Software Change Workflow: Requirements → Risk Assessment → Testing (in Staging) → Approval → Notification → Release → Monitoring.
- Leverage CI/CD for Speed & Safety: Automate testing and deployment, but maintain approval gates and monitoring for high-risk changes.
- Environment Hierarchy: Dev (safe to break) → Staging (realistic test) → Production (customer-facing). Never test in Production.
- DevSecOps Mindset: Security is everyone's responsibility—bake security checks into every CI/CD step, not as an afterthought.
Agile IT Operations & Modern Methodologies#
Agile extends beyond software development into IT operations and infrastructure management.
DevOps:
- Breaks down silos between development and operations teams.
- Emphasizes automation, collaboration, and rapid iteration.
- Continuous delivery of infrastructure updates, patches, and features.
DevSecOps:
- Integrates security into DevOps practices.
- Security is a shared responsibility across dev, ops, and security teams.
- Automated security scanning, compliance checks, and threat modeling.
Scaled Agile (SAFe) in IT Governance:
- Coordinates multiple Agile teams across large organizations.
- Aligns product releases with business strategy.
- Regular planning increments and PI planning sessions.
- Know the Governance Frameworks: COBIT (IT governance/control), ITIL (service management), ISO 27001 (information security), NIST (security/risk guidance).
- Governance Hierarchy: Policies (high-level rules) → Standards (required specs) → Procedures (step-by-step) → Guidelines (best practices).
- ESG Matters: Projects increasingly must consider Environmental, Social, and Governance factors—sustainability, data privacy, and ethical practices.
- Security is Multidimensional: Physical (facilities, devices), Operational (people, processes), and Digital (systems, access) all work together.
- Compliance is Non-Negotiable: Understand GDPR, HIPAA, CCPA, SOX, and jurisdiction-specific regulations. Non-compliance carries steep penalties.
- Cloud Models Offer Flexibility: Choose IaaS for infrastructure control, PaaS for development speed, SaaS for business applications, and XaaS for specialized services.
- Change Control Prevents Disasters: Whether infrastructure or software changes, follow proper workflow: requirements → risk assessment → testing (in Staging) → approval → release → monitoring.
- Modern Practices Drive Efficiency: DevOps, DevSecOps, CI/CD, and Agile operations enable faster, safer deployments while maintaining control and security.
- Multi-Tier Architecture Scales: Separate presentation, application, and data tiers for independent scaling, maintenance, and security.